
The stack is such a key element of every C program that too often we take it for granted and we don’t spend enough time to make sure we have it set properly. Most often we resolve to look into it only by the time we notice the code is mis-behaving and by trial and error, among many other things, we finally decide to make some more room for it and see if things improve… There has to be a better way to check and debug our stack allocation strategy.
To start with you need to understand how the linker allocates space for it (where and how much) and how we can control the process.
Considering only the PIC24F architecture (the dsPIC and PIC24H will add a few twists to what follows) the stack is defined by the linker as the largest (and last) block of RAM allocated after everything else has been taken care of…
In the simplest possible situation, starting from the lowest RAM addresses (right after the interrupt vectors tables) you will see the linker placing all your programs (global) variables and those required by the libraries you used. Then you will see the Heap (if any size>0 is defined) and last the stack, using up ALL the memory that remained available. A picture is worth a million words, here is what an example for a simple project using the PIC24FJ128GA010 would look like:
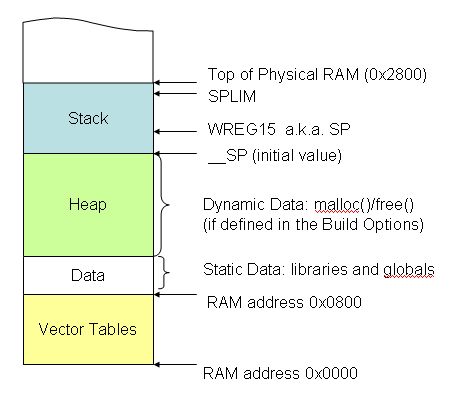
Since the stack of the PIC24 grows toward higher addresses as you use it, the stack pointer (WREG15) is initially set at the bottom of the stack area (__SP) by the C startup code. The stack limit register (SPLIM) is also set at this time to be an address just 8 bytes below the physical end of the memory space. The function of SPLIM is that of triggering a trap when our application reaches the upper limit and runs out of stack space.
The trap mechanism is very similar to an interrupt (of the highest possible priority) that calls a specific vector (_StackError) where we can place a handler routine. The MPLAB C30 compiler places a default handler (just a reset instruction) in each trap and each empty interrupt vector unless otherwise instructed. We can of course define a custom trap handler, but first let’s look at how we can control the amount of space reserved for the stack.
The project Build Options dialog box (select Project>Build Options>Project or click on the Build Options button  ) is the obvious place where to look and in particular the MPLAB LINK30 pane:
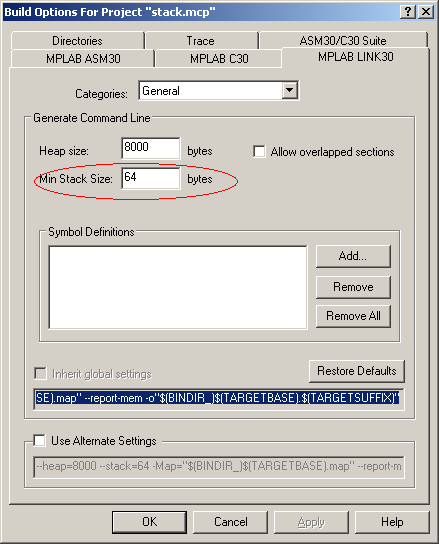 Here the Heap size and Min. Stack size parameters can be passed to the linker.
Notice that I marked in bold the word Min here, because it is way too easy to simply ignore this detail. In fact while we get full control on the size of the Heap, for the Stack we are given only the option to specify a “threshold” below which the linker will be required to “notify us”. The parameter we select here is NOT the value that will be used by the linker to set the initial stack pointer (__SP or WREG15) and/or to decide where the stack limit (SPLIM) is to be set! As we said above, the linker will first allocate all the other memory “objects” and then assign the largest remaining block of memory to the stack. So in other words, the true stack space size is defined sort of by default, as a result of the combination of all the other project parameters.
When all is said and done, the linker finally looks back and verifies that the size it came up with is larger than the Min Stack Size parameter we set. If it is not we get a compile time error right away. But if there is no error, the stack size could be actually much larger than the minimum amount we asked for.
Note that, probably because of my assembly programming background, this behavior is almost the opposite of the way I used to picture it to be. In my mind the stack size was the one deliberately assigned (just like I used to assign manually my stack pointer in the good old assembly days) and the Heap was supposed to be taking the left overs!
As a side effect of this allocation strategy, and mixing it with my (wrong) initial assumptions, I would like to illustrate a scenario that lead me in the past to considerable trouble and had me quite puzzled for a while.
In my application using both large global arrays and dynamic memory allocation (malloc()) I had the Min. Stack parameter set to 512 bytes and the Heap parameter set to 4,192. The application would run normally under these conditions, but the need for more dynamic memory and a few back of the envelope calculations induced me to think that I could really afford to allocate more space for the Heap (according to my estimates I was using only 1,512 bytes of RAM for my global variables) while keeping the stack safely to the present size. So I did increase the Heap size to 6k bytes, the linker did not complain about any issue with the stack, but the application started immediately behaving erratically producing inexplicable occasional resets.
What was going on?
To my surprise, after a lot of head scratching, I realized that my application was really using almost 1Kbytes of stack space. When the Heap was originally set to 4K bytes the Stack had been allocated as much as 2.5K bytes (8K-4K-1.5K=2.5K). A number larger than the minimum I was requesting.
When I increased the Heap size to 6K, the Stack got squeezed to 512 bytes (8K-6K-1.5K=.5K) still ok according to my request to the linker (notify me if less than 512…) but definitely not enough for the appetite of my application.
It is easy to fall in this trap (pun intended) and assume that since your Build Options are specifying X amount of bytes for the Stack, and your application is not crashing, your stack usage is X bytes or less. The actual amount of stack your application has been allocated and might be currently using could be much larger than the minimum specified. Finding out exactly how much could be quite tricky!
One quick reality check can be easily performed though, courtesy of the MPLAB C30 compiler (default options), you can inspect the build report in the output window Build pane: 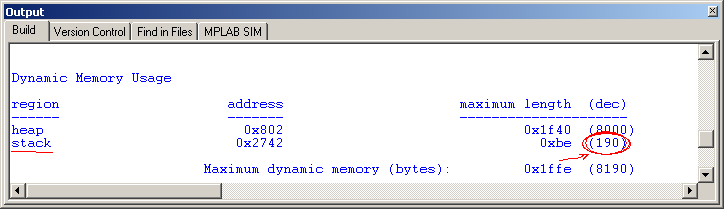
Circled in red is the actual stack size that, as you can see in the example, is lager (192) than the amount specified in the project build options (64, see previous picture).
But once more, don’t fall in a “new” trap, the reported “allocated” stack space is not telling us how much of it is actually used by the application!
(to be continued…)


