
In the last several months I have seen a couple of postings on the PIC32 forum about users testing the speed of the PIC32 I/O. It is quite normal and healthy for a community of Embedded Control designers to worry about the actual I/O performance of a microcontroller, and even more so when the microcontroller in question claims to be able to operate all its peripherals (I/O pins included) at the same (top) speed of the core: 80MHz!
With such capability and thanks to the special Atomic I/O operations (PORTINV), the theory says that a PIC32 could produce a 40MHz output square wave!
This performance is quite unique among competing microcontrollers (they typically achieve 1/2 the processor top speed), but we have to admit it can be tricky to prove. Here is what I recommend you do to get as close to the theoretical limit as possible… First of all I will assume that you have read the “Exploring the PIC32” book and in particular chapter (7) titled: “Running”. In other words you must know that the PIC32 requires a little “tuning” to be performed at run time, typically at the top of your main program, to operate at top efficiency. This includes enabling the cache, setting the optimal number of wait-states (if any required) for the chosen clock speed, and configuring the Peripheral Bus Divider or PBDIV.
If you are lazy as I am, you will have a call to the SYSTEMConfigPerformance( ) function right at the top of your main() to do all of the above in one single line of code.
But this won’t be enough yet, there are a few additional things to check:
1- Make sure you know your PBDIV
By default PBDIV is set at 1:8 ratio unless you use a #pragma config to change it, or you modify it at run time (as per above).
Notice that the function SYSTEMConfigPerformance(), in “old” versions of the C32 compiler libraries used to arbitrarily limit the maximum speed to 40MHz (so if you were selecting 72MHz or 80MHz it would change PBDIV to 1:2 without telling you!). New versions of the compiler libraries (after v1.03) do NOT limit the PB speed and will produce a 1:1 ratio by default.
2- Use at least Optimization level O1 of MPLAB C32 compiler (always available even in the student version) and take a look at the disassembly window.
At optimization level zero (O0, the default for the compiler) the code produced for a single I/O access is pretty long and inefficient. At optimization level O1 things get decidedly better, but are still very inefficient if all you are trying to perform is sequential toggles as fast as you can.
3- Unroll your loops.
This is a simple (perhaps the simplest) optimization technique that reduces the overhead of the loop by distributing the additional cycles (1) over a larger section of code
But no matter how hard you try, nothing will get as fast as a few lines of MIPS assembly.
Not something I would recommend everyday, after all one of reasons why we are using a fast 32-bit processor is to try and make use of C code for all our needs. Yet this is one of those special cases…
Here is an example project:
It is composed of two source files:
1- toggle.s, written in MIPS32 assembly defines a toggle() function that performs an infinite loop around 8 pulses (16 toggles) of 2 clock cycles each (a 40MHz bursts) +1 cycle for the loop instruction itself
2- toggle-test.c, is written in C and performs the standard processor initializations for 80MHz operation before calling the toggle() funtion
This is a plot obtained with MPLAB SIM Logic Analyzer window:
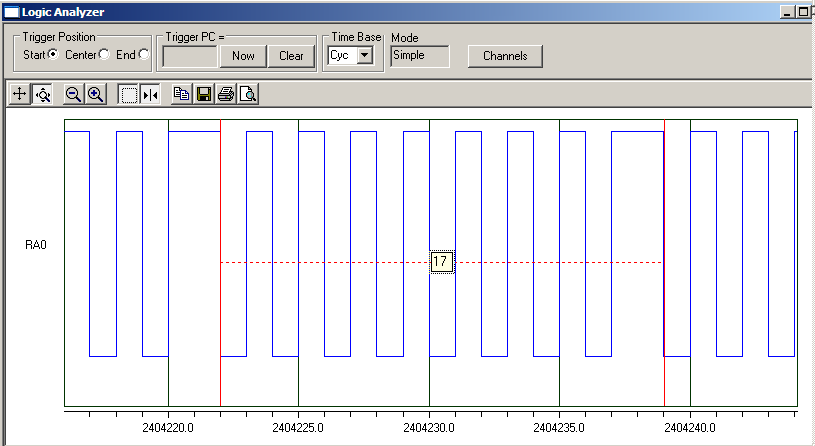
As you can see 17 cycles are spent to produce 8 clock pulses (37MHz+).
Try and unroll more of the loop to get as close to 40MHz as desired until … you will get out of the cache space …
Have fun experimenting…


Nice done!
And it works also like a mini-tutorial to show how to integrate C and assembly + passing parameters. 🙂
By the way, how the MPLAB SIM is accurate in simulating the FLASH waiting states?
I’m asking because, for my curiosity, I’m trying to see the waiting states while reading a table from the ROM but it works always as if there wasnt wait states… always 1 cycle to read the ROM… probably I’m wrong somewhere…
In your example, if code is located in FLASH the branch works without any cycle lost (tanks to the branch slot) but only if instructions are located in the chache memory.
Otherwise the cpu would be stalled for 2 cycles, I presume…
I’m wrong?
Anyway, if someone wants to use asm code to perform hi-speed bit-toggling, the suggestion would be to alling the code to chache rows in order to keep most instruction inside.
Or, better, to relocate the code in RAM, where there are no wait cycles…
Trying to count and optimize the asm code down the single clock cycle detail gets very complicated very quickly… but let’s say that you are on the right track… In fact the branch slot makes use of one clock cycle, while the pre-fetch mechanism attempts to get the (jump target) instruction. If this is within the last 256 bytes fetched (most likely) the cache will hit and there will be no stalling whatsoever…
As per MPLAB SIM, there is a very crude attempt at estimating the actual number of cycles, cache included, but the ultimate test of truth is running the code on the REAL ICE and looking at the stopwatch.